Q4 2025 NORMANDY SHORES & NORMANDY ISLE - SINGLE FAMILY HOMES
4TH QUARTER OF 2025 VANESA CARPIGNANO December 29, 2025
4TH QUARTER OF 2025 VANESA CARPIGNANO December 29, 2025
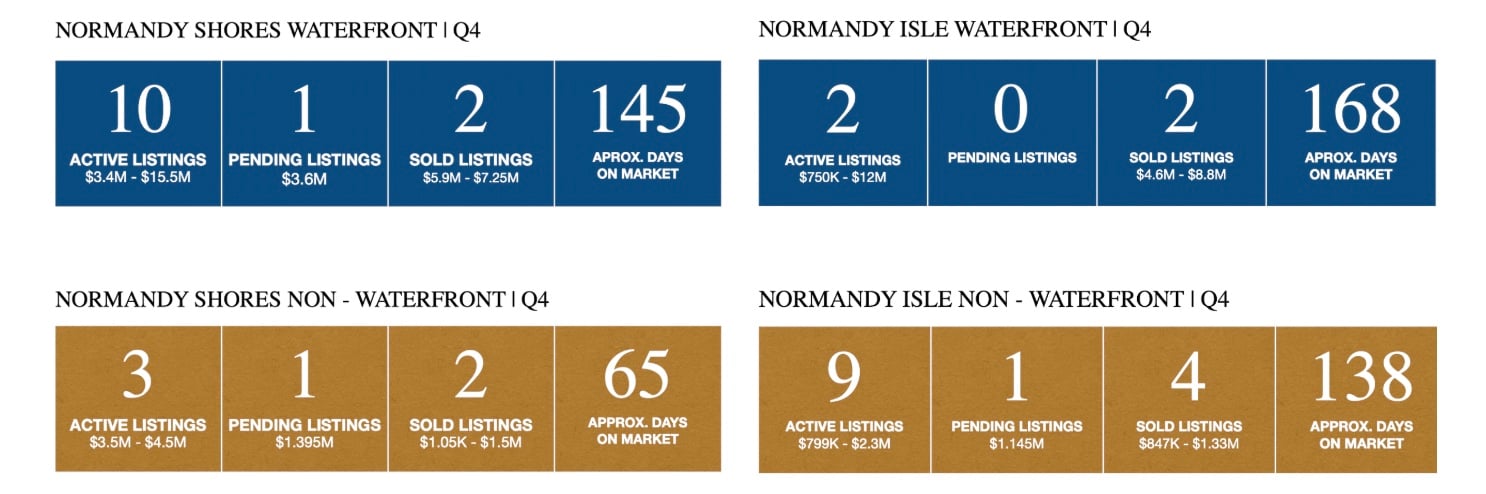
As we close out 2025, the Normandy market reflects a clear shift toward normalization. Q4 confirmed what we’ve been seeing all year: buyers remain active but disciplined, pricing accuracy matters more than ever, and the gap between aspirational pricing and market reality is being decisively tested—especially in the luxury waterfront segment.
NORMANDY ISLE – INVENTORY & SALES INSIGHTS:
Normandy Isle remains a value-driven market with strong differentiation between waterfront and non-waterfront properties.
Waterfront Sales:
Two waterfront homes closed in Q4, with sold prices reflecting meaningful adjustments from original list prices. Homes spent between 90–156 days on market, reinforcing the need for realistic expectations in this segment.
Non-Waterfront Activity:
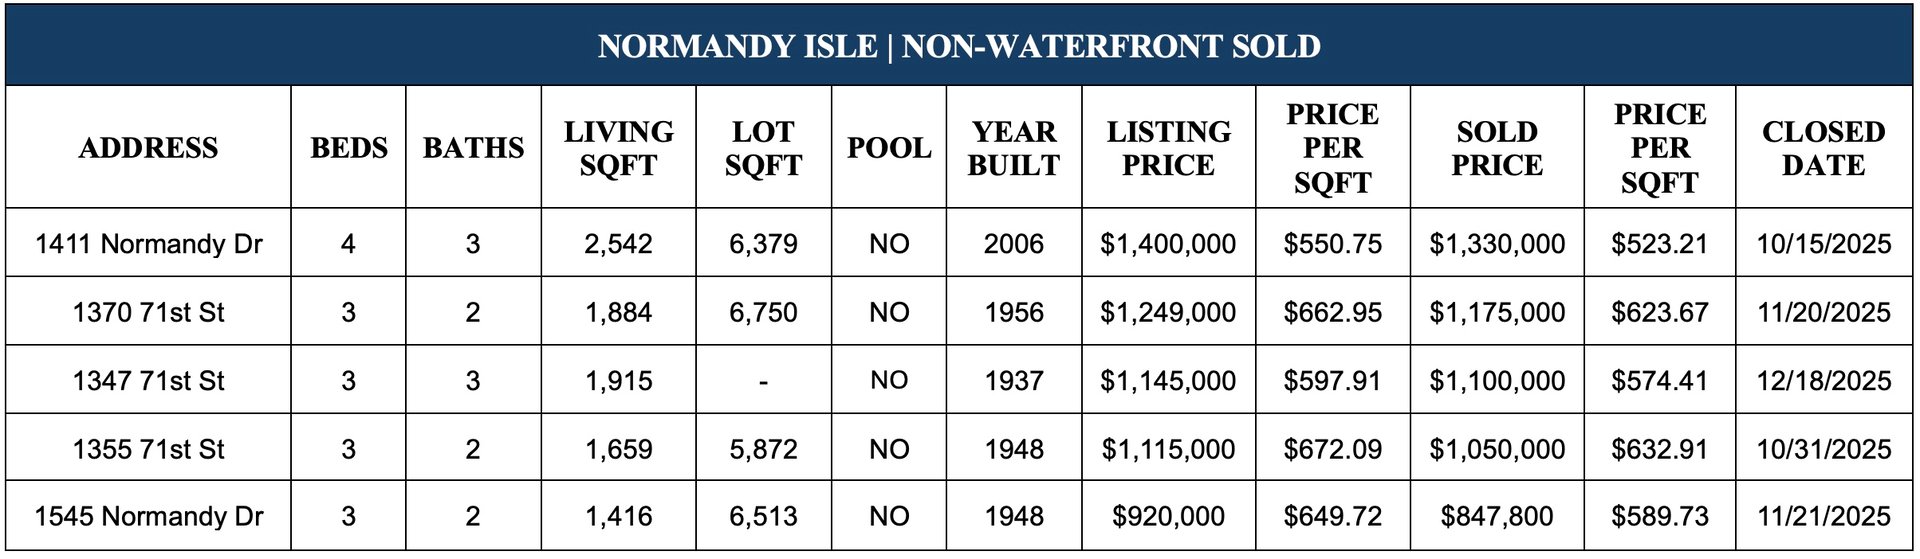
This segment continues to anchor the neighborhood’s activity. Multiple Q4 closings occurred between approximately $850K and $1.33M, with average days on market ranging from 70–150 days. Homes priced in line with comparable sales consistently outperformed overpriced listings, while cancellations largely stemmed from unrealistic pricing strategies.
NORMANDY SHORES – INVENTORY & SALES INSIGHTS:
Normandy Shores remains firmly positioned as a luxury-driven market, though Q4 clearly highlighted its bifurcated nature.
Waterfront Market:
Several high-profile waterfront closings occurred in Q4, including sales above $7M that validated strong demand for premium homes when pricing aligns with quality and location. However, active listings continue to show wide pricing dispersion, with some homes exceeding 300–500 days on market—clear evidence that buyers are resisting overreach.
Non-Waterfront Homes:
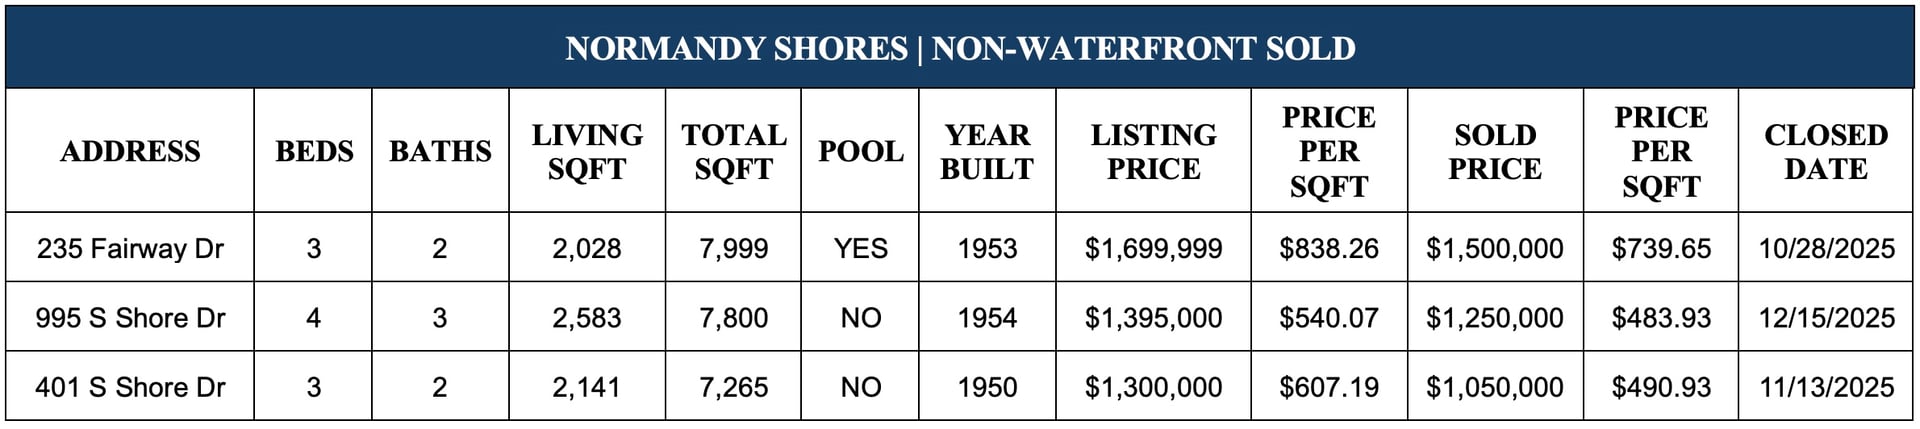
While limited in supply, non-waterfront sales closed efficiently in Q4, many within weeks rather than months. These properties continue to attract buyers seeking entry into the neighborhood without competing in the ultra-luxury waterfront tier.
As we move into 2026, Normandy Shores and Normandy Isle are positioned as stable, opportunity-driven markets rather than momentum markets. Buyers are engaged, capital remains available, and demand is real—but only for homes that are priced and presented with precision.
For sellers, success hinges on strategic pricing, standout presentation, and flexibility. For buyers, Q4 reinforced that leverage exists—particularly in the luxury segment—when patience and data-driven decision-making are applied.
If you’re considering buying, selling, or simply want to understand where your property fits in today’s market, I’m always happy to help. I live here, work here, and take pride in guiding my neighbors with clarity, honesty, and local expertise.
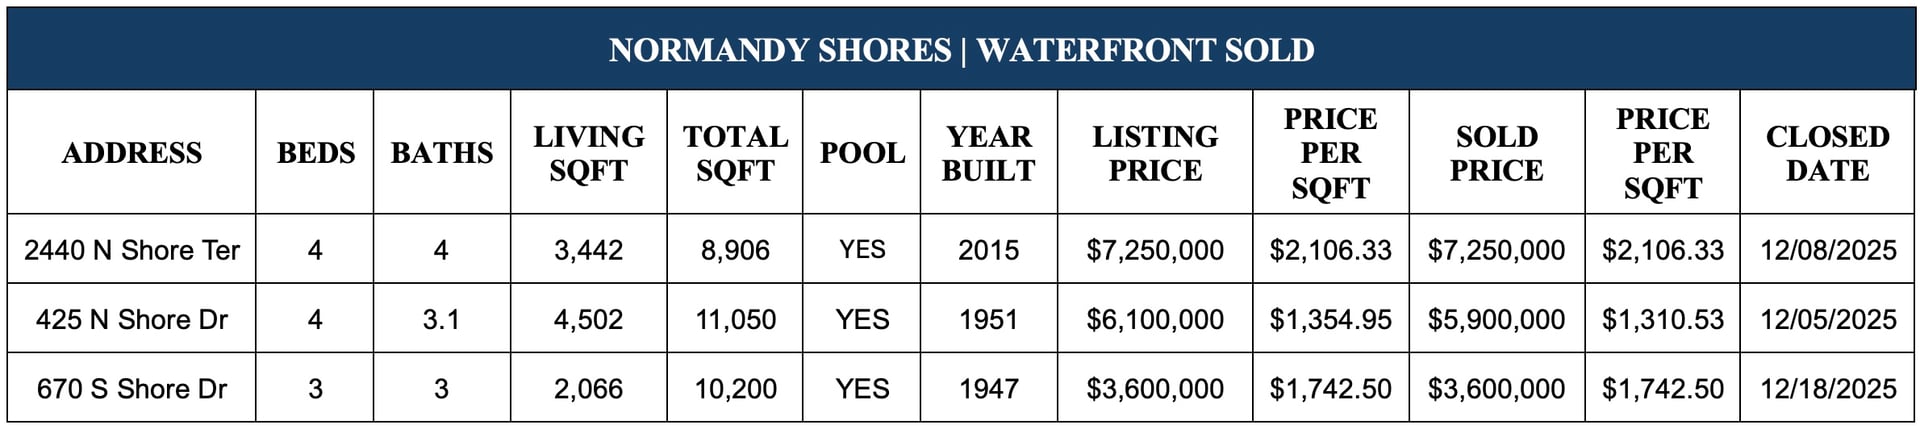


DAYS ON THE MARKET:
AVERAGE DOM: 112.7 days (3.7 months)
Median DOM: 44.5 days (1.5 months)
___________________________________________________________________________________________________________
DAYS ON THE MARKET:
Average DOM: 134 days (4.4 months)
Median DOM: 93.5 days (3.1 months)
Based on information from the Miami Dade County Property Appraiser. This information may or may not include all properties sold in Normandy Shores Waterfront during the reporting period. The accuracy of information in this report is dependent upon the aforementioned source, and is not guaranteed. If your property is presently listed with another broker, this is not a solicitation of that listing.
Stay up to date on the latest real estate trends.
BLOG POST
October 5, 2026
BLOG POST
September 21, 2026
BLOG POST
September 21, 2026
BLOG POST
September 21, 2026
BLOG POST
September 21, 2026
BLOG POST
September 21, 2026
BLOG POST
September 21, 2026
BLOG POST
September 21, 2026
BLOG POST
September 21, 2026
Combining her multi-cultural international business background, advanced marketing communication strategies, and savvy negotiation skills, Vanesa provides her sophisticated national and international clientele with comprehensive Real Estate Services and Consulting. Contact Vanesa today!
VANESA CARPIGNANO
1021 Kane Concourse
Bay Harbor Islands, FL 33154