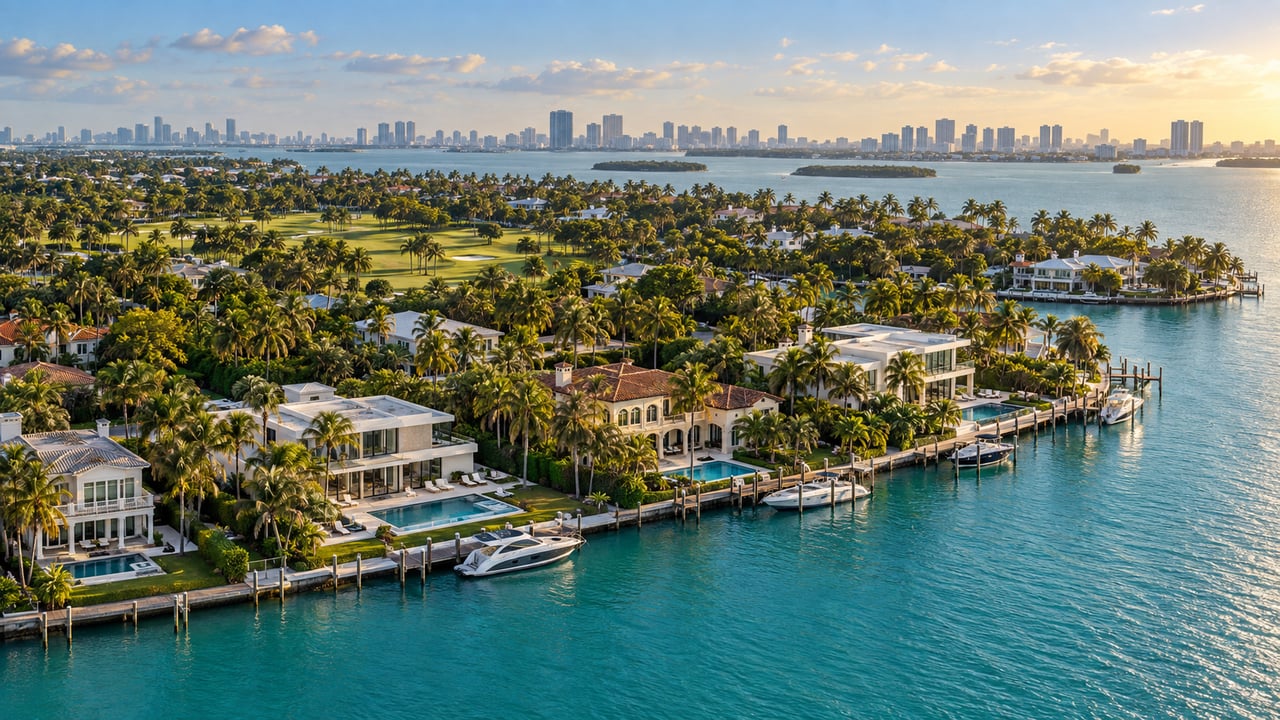
Q3 NORMANDY SHORES & NORMANDY ISLE - SINGLE FAMILY HOMES
3RD QUARTER OF 2026 Vanesa Carpignano September 28, 2026
3RD QUARTER OF 2026 Vanesa Carpignano September 28, 2026
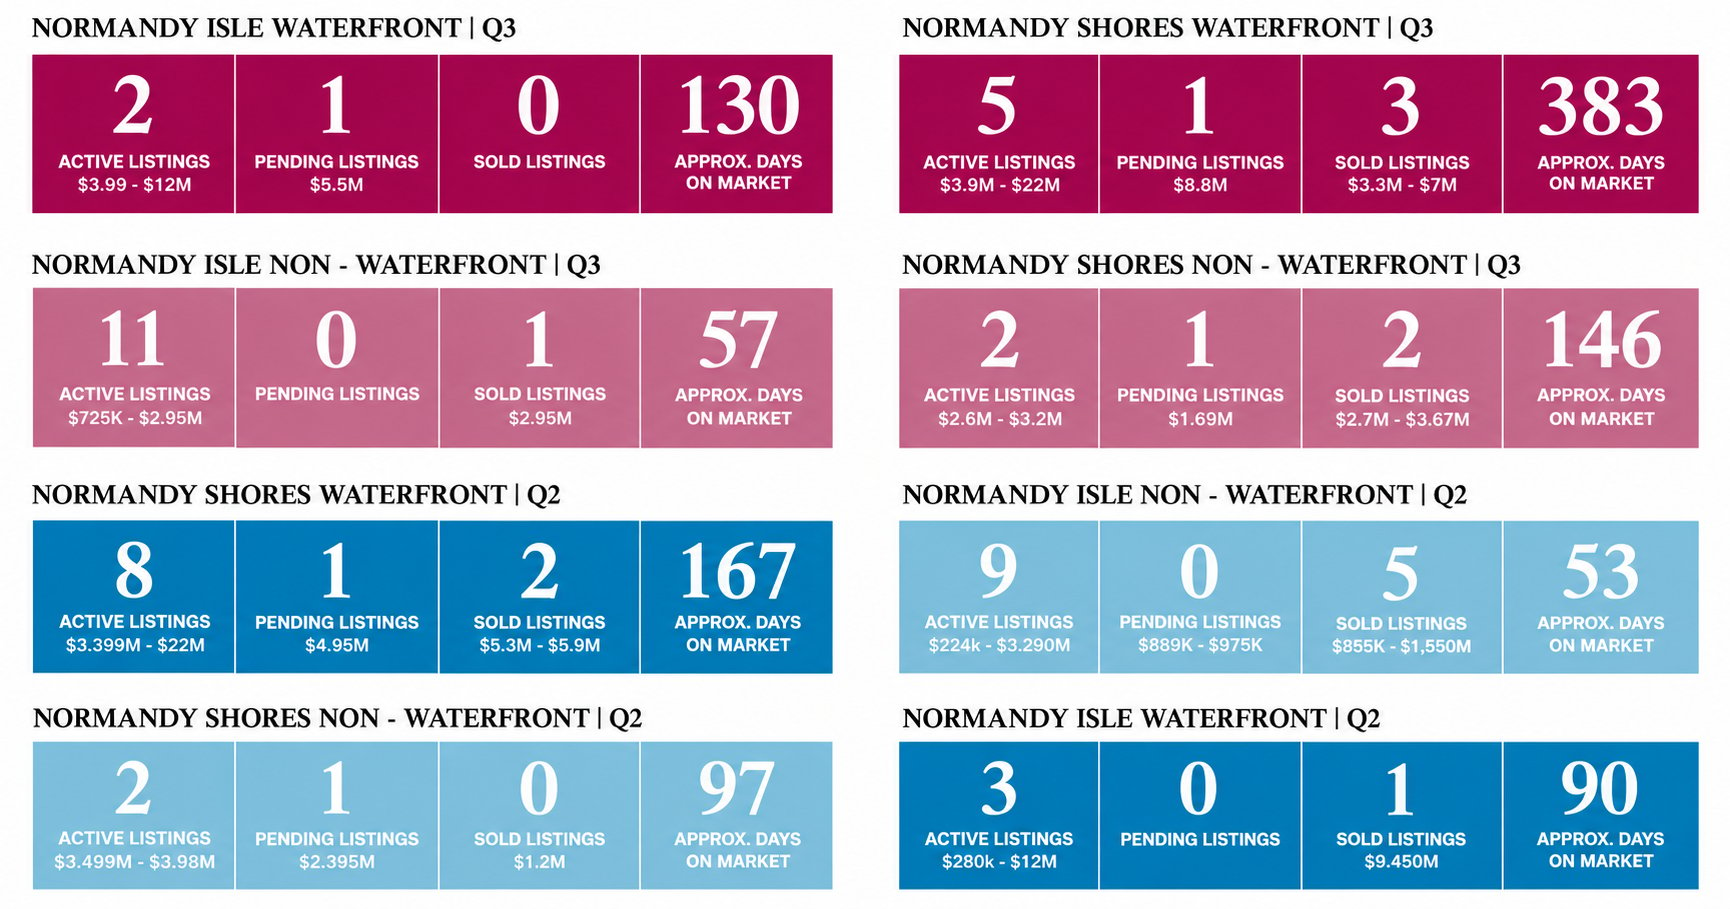
The third quarter of 2026 brought contrasting results for Normandy Shores and Normandy Isle. Normandy Shores recorded a 150% increase in closed sales and a 30% decline in active inventory compared with Q2. Normandy Isle saw sales decline 83% while inventory increased approximately 8%. These results highlight the importance of evaluating each neighborhood and property segment individually.
NORMANDY ISLE – INVENTORY & SALES INSIGHTS
Normandy Isle recorded one completed single-family home sale during Q3, compared with six in Q2. With more available inventory and fewer transactions, buyers had a broader selection of properties to consider.
Waterfront Activity: Two waterfront homes were available: 1525 Calais Dr at $3,990,000 and 1398 Bay Dr at $12,000,000. 1920 Bay Dr was pending at $5,500,000, reflecting land value and the appeal of an open-bay location. No waterfront homes closed during the quarter.
Non-Waterfront Sales: 1311 Bay Dr was the neighborhood’s only completed single-family home sale, closing for $2,950,000 on August 31, 2026. The property was listed by Howard Chase.
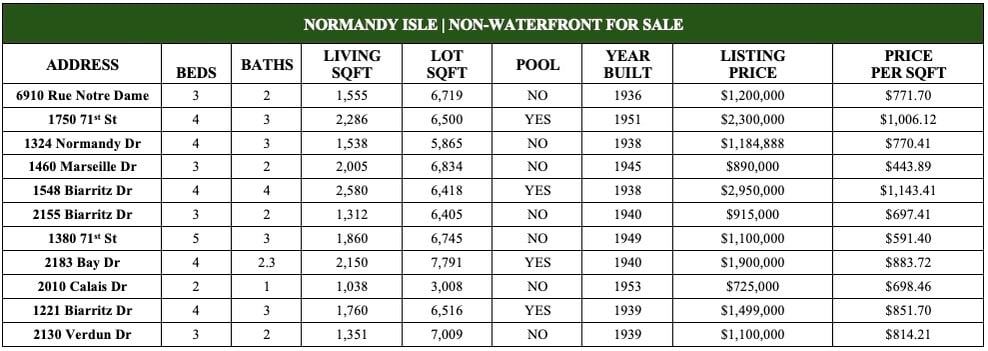
Available Inventory: Eleven unique non-waterfront homes were available, with asking prices ranging from $725,000 to $2,950,000. No non-waterfront homes were pending.
Market Position: The increase in inventory alongside fewer sales gives buyers more choices and reinforces the importance of competitive pricing for sellers. With only one closed sale and one pending home, the quarter provides a limited sample for assessing transaction timelines.
NORMANDY SHORES – INVENTORY & SALES INSIGHTS
Normandy Shores delivered a strong Q3, with five closed sales compared with two in Q2. Waterfront sales increased 50%, from two to three, while two non-waterfront homes also closed.
Available Inventory: Active inventory declined 30%, driven by a 37.5% decrease in waterfront listings, while non-waterfront inventory held steady. Five waterfront and two non-waterfront homes were available, with one additional property under contract in each segment.
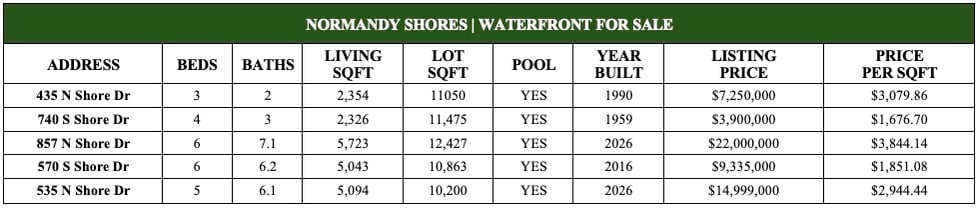
Waterfront Market: Asking prices ranged from $7,250,000 to $22,000,000 on N Shore Dr and $3,900,000 to $9,335,000 on S Shore Dr. 470 S Shore Dr was active with contract at $8,800,000. Waterfront comparisons should account for boating access, including fixed bridges, alongside frontage, condition and redevelopment potential.
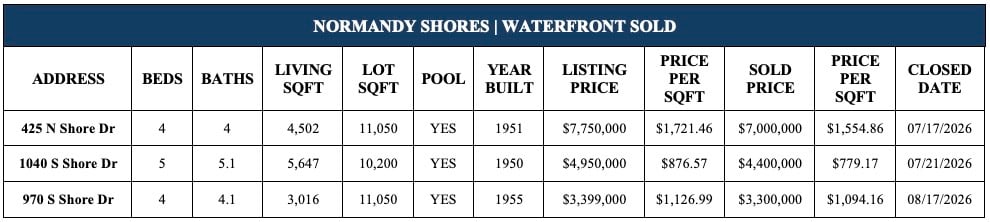
Waterfront Sales: 425 N Shore Dr led the quarter, closing for $7,000,000 on July 17, 2026, listed by Antonio Correa. This was Normandy Shores’ highest sale across Q2 and Q3, approximately 19% above Q2’s highest sale of $5,900,000.
The other waterfront closings were 1040 S Shore Dr at $4,400,000 on July 21, 2026, and 970 S Shore Dr at $3,300,000 on August 18, 2026. The latter reflected land value and was listed by Bill Hernandez.
Non-Waterfront Activity: Two Fairway Dr homes were available at approximately $2,600,000 to $3,200,000, while 485 S Shore Dr was pending at $1,690,000.
Non-Waterfront Sales: 270 N Shore Dr, a new build listed by Fernanda Ibarra, closed for $3,670,000 on September 22, 2026. 545 S Shore Dr, listed by Ashley Alvarez, sold for $2,700,000 on August 28, 2026.
Market Pace: Across the five sold and two pending homes, average cumulative days on market were approximately 281 days, with a median of 135 days. One completed sale had accumulated 1,128 days on market, substantially raising the average. The quarter’s stronger sales therefore included the absorption of long-standing inventory.
THE LOCAL TAKEAWAY
Normandy Shores recorded more sales and fewer available listings, while Normandy Isle offered buyers more choice amid slower transaction activity. These are distinct market conditions that call for property-specific pricing and marketing strategies.
For sellers, recent comparable sales, condition, location and boating access should guide positioning. For buyers, available inventory offers opportunities to evaluate value carefully across both neighborhoods.
If you’re considering buying, selling, or simply want to understand where your property fits in today’s market, I’m always happy to help. I live here, work here, and take pride in guiding my neighbors with clarity, honesty, and local expertise.




DAYS ON THE MARKET:
AVERAGE DOM: 281 days
Median DOM: 135 days
___________________________________________________________________________________________________________


DAYS ON THE MARKET:
Average DOM: 57 days
Median DOM: 146 days
Based on information from the Miami Dade County Property Appraiser. This information may or may not include all properties sold in Normandy Shores Waterfront during the reporting period. The accuracy of information in this report is dependent upon the aforementioned source, and is not guaranteed. If your property is presently listed with another broker, this is not a solicitation of that listing.
Stay up to date on the latest real estate trends.
BLOG POST
October 5, 2026
BLOG POST
September 21, 2026
BLOG POST
September 21, 2026
BLOG POST
September 21, 2026
BLOG POST
September 21, 2026

BLOG POST
September 21, 2026
BLOG POST
September 21, 2026
BLOG POST
September 21, 2026
BLOG POST
September 21, 2026
Combining her multi-cultural international business background, advanced marketing communication strategies, and savvy negotiation skills, Vanesa provides her sophisticated national and international clientele with comprehensive Real Estate Services and Consulting. Contact Vanesa today!
VANESA CARPIGNANO
1021 Kane Concourse
Bay Harbor Islands, FL 33154